When growers request lighting proposals from different suppliers, the light plans they receive can vary significantly, even when they are based on the same greenhouse and identical crop requirements. "At first glance, one plan may appear superior on paper. However, these differences are often driven by varying assumptions rather than actual performance. Without aligning these underlying parameters, comparing proposals can quickly become misleading", the Mechatronix team explains. "At MechaTronix, we regularly support our growers in evaluating their lighting proposals, and one thing is clear: understanding what's behind the numbers is essential to making the right investment decision."
That's why they highlighted five key aspect that should always be checked to ensure a fair and reliable comparison between LED lighting plans.
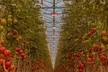
1. Start with crop distance and free height
One of the most fundamental parameters in any light plan is the distance between the fixture and the crop, also referred to as the free height.
Even small differences of just a few centimeters can have a noticeable impact on both light intensity and uniformity. That's why it is crucial to confirm that all suppliers use the same crop distance in their simulations.
In addition, growers should take into account different growth stages. By requesting simulations at multiple crop heights, it becomes easier to understand how light levels evolve throughout the cultivation cycle, particularly during critical phases. This approach is something we consistently recommend when supporting growers in project design.
 © Mechatronix
 © Mechatronix
2. Align simulation settings
Lighting simulation software allows for a wide range of settings and calculation modes. If these differ between proposals, the results cannot be directly compared.
A common example is the light spectrum or "light recipe." Simulations based on a 90-5-5 spectrum will produce different outcomes than those based on a 95-5 configuration.
To ensure consistency, growers should verify that all proposals are based on identical simulation settings and clearly specify their preferred spectrum from the outset. Establishing this clarity early in the process avoids confusion later on.
 © Mechatronix
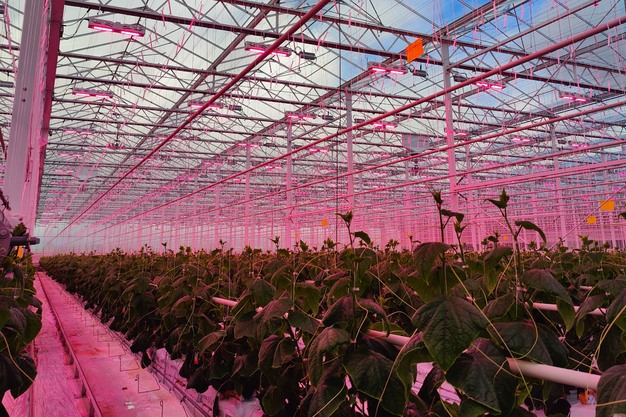
3. Compare the calculation area
Another important factor is the size and location of the calculation area used in the light plan.
Some simulations focus only on a limited zone directly beneath the fixture. While this may produce attractive numbers, it does not reflect real greenhouse conditions.
A representative calculation area should cover a realistic section of the cultivation space, providing insight into the overall light distribution. Growers may also request additional zones, such as areas near walls or paths—to identify potential weak spots.
As a general rule, reflections should be set to 0% unless the exact reflectivity of greenhouse surfaces is known. In our experience, this leads to more realistic and reliable outcomes.
 © Mechatronix
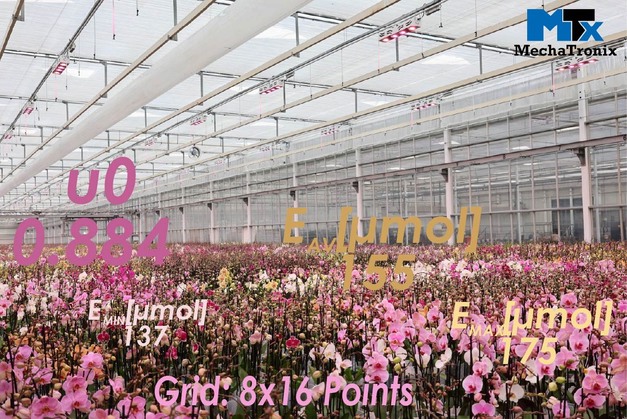
4. Understand the grid behind the numbers
Most light plans include a calculation grid, but its importance is often underestimated.
The grid defines how many data points are used to calculate light levels (µmol/m²/s) and the associated minimum and maximum values. A denser grid results in a more accurate and detailed representation of the light distribution.
Conversely, a coarse grid with only a few points can oversimplify the results and reduce reliability. While this may be sufficient for an initial estimate, a detailed evaluation requires a higher data resolution.
Together with a properly defined calculation area, a sufficiently dense grid provides a realistic picture of light intensity and highlights areas that may require attention, something we always prioritize in our own light studies.
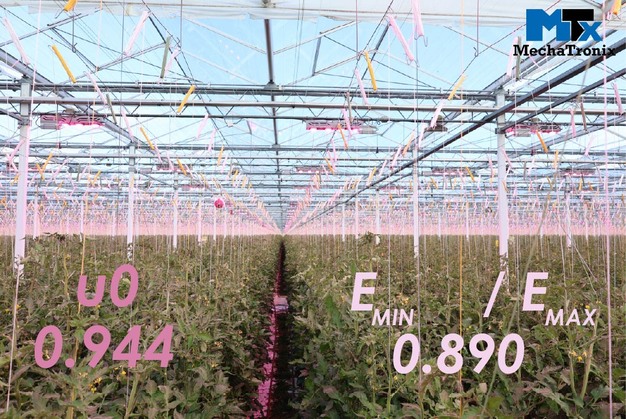
5. Evaluate uniformity the right way
Uniformity is a critical factor for achieving consistent crop performance. However, it can be expressed in different ways.
Two commonly used metrics are:
Min/Max ratio: the ratio between the lowest and highest light levels. This indicates the contrast within the greenhouse. A low value suggests strong variation, which can lead to uneven growth.
U₀ (uniformity ratio): the ratio between minimum and average light levels. This provides a more comprehensive view of how evenly light is distributed across the crop.
For a complete assessment, it is advisable to consider both metrics. Together, they offer a clearer understanding of the lighting quality and its potential impact on plant development.
A light plan is more than just a simulation
A lighting plan should be seen as a blueprint for the final installation, not just a set of theoretical values. By aligning key parameters and understanding what lies behind the numbers, growers can make meaningful comparisons between different proposals and identify which solution truly delivers value in practice.
Taking the time to evaluate these details upfront helps prevent surprises after installation and ensures that the lighting system performs as expected throughout the entire growing cycle.
Supporting growers with transparent light plans
Reviewing light plans can be complex, especially when multiple variables are involved. "At MechaTronix, we believe transparency and clarity are key. By guiding growers through every detail of a light plan, we help ensure that decisions are based on realistic expectations rather than assumptions. Ultimately, a well-evaluated light plan is the foundation for a successful lighting installation and a more predictable growing result."
Meet Mechatronix at GreenTech Amsterdam in stand 3.101
For more information:
MechaTronix
[email protected]
www.horti-growlight.com
linkedin.com/mechatronix-led