The area of tomato cultivation under light in Flanders has increased slightly in recent years. Growers nowadays grow all sorts of tomatoes, from 'standard' loose and vine tomatoes to all sorts of specialties.
In addition to the different varieties, the choice of whether or not to grow tomatoes in a greenhouse and what type of lighting to use also creates great variation in the sector. Karlien Van den Broeck, horticultural adviser at Boerenbond and Bart Baets, business economics adviser at SBB Accountants & Advisors, list a number of figures about the sector and the various types of cultivation.
Sector evolves
In Belgium, tomato cultivation is mainly located in Flanders. More than 98% of the cultivated area is in Flanders. Figure 1 makes it clear that the province of Antwerp is the leader in terms of the area under tomato cultivation in Flanders.
In 2019, almost three quarters of the Flemish area (403 ha) was located in the province of Antwerp, followed by East Flanders (with approximately 12.8% of the total area, 69 ha) and West Flanders (with approximately 11% of the total area, 60 ha). Between 2015 and 2019, the total area of tomatoes in Flanders increased by almost 50 ha (Statbel, 2021).
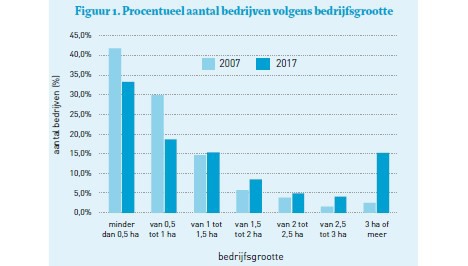
The cultivation companies with vegetables under glass have been increasing in size in recent years. Figure 2 shows that in 2007 4.1% of the companies were more than 2.5 ha. In 2017, this number had increased to 19.3% of the companies.
In terms of area, companies with a size of more than 2.5 ha took up 61.7% of the area, compared to 19.5% in 2007. There is a clear tendency for the number of companies to decrease, but the companies to increase in size. In addition, the share of soil-bound tomato cultivation has been declining for several years in favour of tomato cultivation on substrate.
Cost price analysis
In recent years, more companies have been chosen. As a result, the number of companies rose sharply between 2001 and 2013. Accountancy and consultancy firm SBB has found that 80 to 90% of businesses opt for a company form. It has compared more than 20 tomato companies on the basis of a fixed pattern. These companies all have a CHP and the surface area varies between 1.5 ha and more than 12 ha. The analysis compared the companies globally as well as the companies with and without lighting and with loose or vine tomatoes compared to companies with specialties.
The analysis looked at various items in the company accounts. For the revenue of the companies, the sale of the tomatoes, the energy of the cogeneration plant and cogeneration certificates were taken into account. The cost items included credit charges (less than one year), goods for resale (seed and planting material, fertilisers, crop protection and disinfection, fuel, etc.), services and miscellaneous goods (CHP maintenance, insurance, etc.), labour and other operating costs.
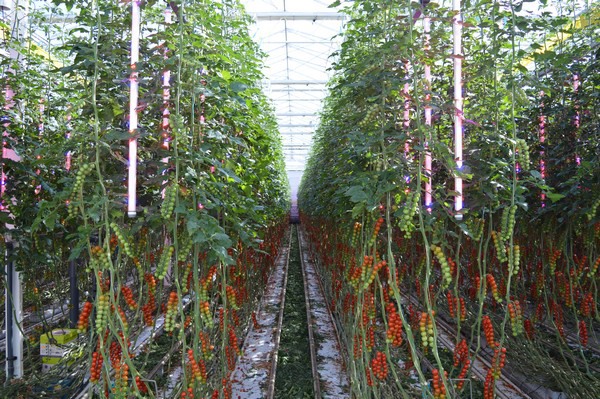
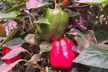
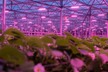
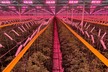
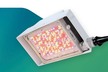
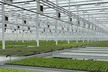
Cultivation under light of specialties in a Flemish tomato production company. Photo: archive GroentenNieuws
Differences in margin according to cultivation method
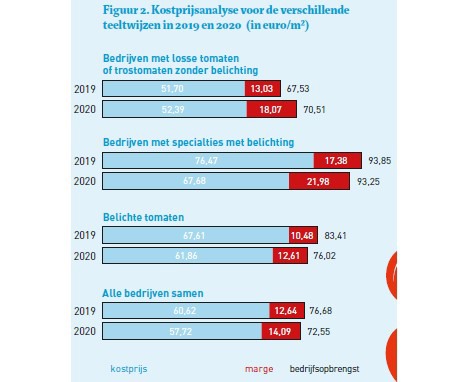
The difference between a company's income and expenditure is the margin. SBB's analysis showed a global margin of 12.64 euros/m² in 2019 (see figure 3). In that year, tomatoes grown under lights had the smallest margin (10.48 euros/m²). The margin on the exposed specialties tomatoes was the highest (€17.38/m²). The loose and vine tomatoes (without light) were in between, with a margin of approximately 13 euros/m².
With these figures, it should be noted that there were large differences between the companies. The yields of the crops under light and the crops of specialties were higher than the unexposed crops of loose tomatoes and vine tomatoes, but the costs were also higher. The comparison showed that the yield of the unexposed farms did not differ structurally from the yield of the exposed cultivation.
In 2020, the margin was highest for the companies without lighting (21.98 euros/m², see figure 4). They were followed by the companies with loose and vine tomatoes without lighting (€18.07/m²) and then by the companies with lit tomatoes (€12.61/m²). The margin depends on all income and expenditure. Besides the income from selling the tomatoes, there is also income from selling energy and obtaining heat certificates.
So the revenues depend on both the volumes and the selling price of the tomatoes and the quantity of heat certificates, the amount of energy sold and the tariff at which it is sold. In 2020, revenues were on average lower than the previous year, partly due to the overall lower prices for the tomatoes. But because the cost price was also lower on average, the effect on the margin was limited.
Focusing on the cost price analysis
When focusing on the cost price analysis, it appears that mainly the trade goods (planting materials, fertilisers, crop protection agents, fuel, etc.) and labour make up an important part of the cost price. Together, they account for 50 to 60% of the total cost price. As far as labour is concerned, it is also noticeable that the cultivation of speciality tomatoes involves higher costs. Picking speciality tomatoes requires more actions, so that the cost price of personnel is on average more than 20 euros/m².
In general, labour costs show an upward trend between 2018 and 2020 for all cultivation methods. There is an upward trend in wages for workers. This could be due to a rising labour cost or to a larger share of permanent labour on the farm. Further analysis is needed to find out which factor is the main determining factor.
It is mainly trade goods and labour (12 to 20 euros/m²) that determine the cost price, but the role of services and miscellaneous goods should certainly not be underestimated. In the companies analysed, these costs often amount to approximately 20% of the cost price. It is also noteworthy that the price of insurance has almost doubled in the period from 2018 to 2020. In 2018, this cost price amounted to an average of 0.55 euros/m², in 2020 1 euro/m².
Know your own figures
Karlien and Bart remind growers that it is important to have insight into the figures of their own business. With business accounting, the grower can visualise their own figures in a clear manner. This gives them insight into the returns and costs of the various crops on the farm. In this way, the grower can make choices in their operational management that are based on the correct figures.
With 'focus', Boerenbond offers a financial management tool tailored to the company, which, according to Karlien and Bart, 'yields much more than traditional accounting'.