The greenhouse industry is prevalent in many areas in North America. In Canada, greenhouses account for approximately 404 acres in Alberta and 3720 acres in Ontario. In the United States, 650 acres in California and 115 acres in New York represent greenhouses. With energy being a greenhouse's second highest expense after labor, we thought exploring a 10 acre 5MW greenhouse’s electricity expenses in various parts of North America would be a valuable case study, especially with the increase in lighting usage by many greenhouses. This study analyzes the following regions in Canada: Alberta, British Columbia, Manitoba, and Ontario and the following regions in the United States: California, New York, and Ohio.
For this case study, we scaled a customer to become a 10-acre vegetable greenhouse with HPS lighting with a demand of 5MW. First, the average daily consumption (MWh) and monthly demand (MW) are shown in Figure #1.
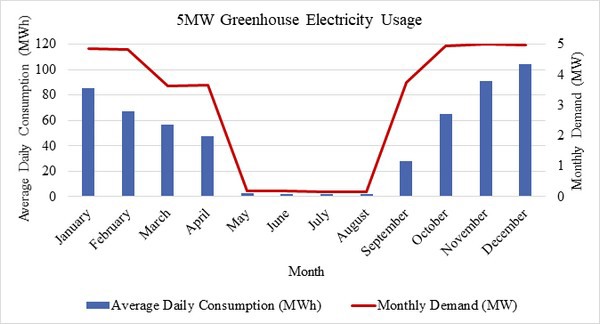
Figure #1: average daily consumption (MWh) and monthly demand (MW)
After performing electricity calculations based on various utilities, commodity costs, and rate options, the 2020 annual electricity cost in CAD for each region can be seen in Figure #2.
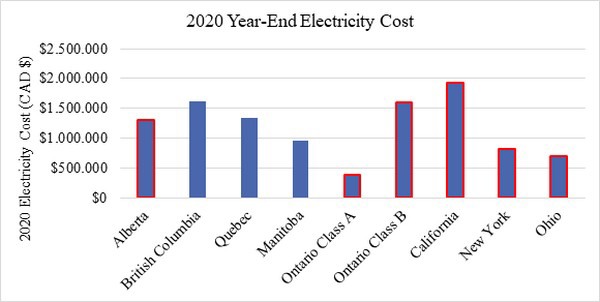
Figure #2: 2020 year-end electricity cost*
These calculations are based on internal and online sources. Particularly, the Ontario Class A price is an example of how 360 Energy works with customers to get the best electricity rate. Note that the red outlined regions are deregulated markets. In these cases, the cost of electricity is taken from the spot market. Alberta is taken from the AESO, Ontario from HOEP, California from CAISO, New York from NYISO, and Ohio from PJM.
Now, the 2020 cost of electricity for this greenhouse by region is shown in Figure #3.
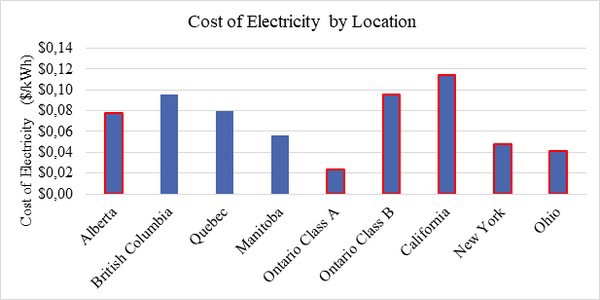
Figure #3: cost of electricity by location*
Lastly, we looked at another important calculation to greenhouses, the total annual electricity charges per meter squared based on location as shown in Figure #4.
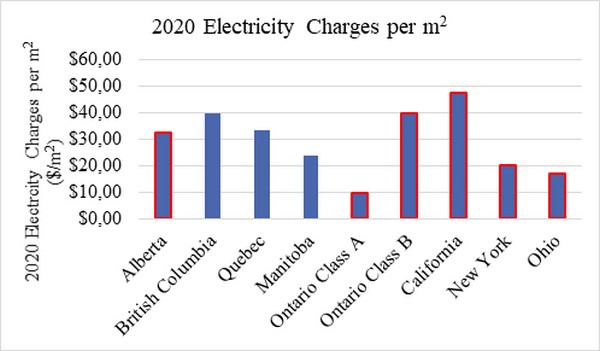
Figure #4: annual cost of electricity per m2*
Overall, we found this study to have some interesting and conversation-provoking results, especially when comparing the deregulated and regulated markets.
*A conversion of $1USD = $1.32136944CAD was used for this study for California, New York, and Ohio. All rates were calculated using publicly available utility rates. Additionally, taxes are not included with this study
For more information: © Kampan Butshi | Dreamstime360 Energy
www.360energy.net