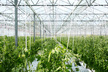
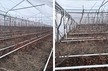
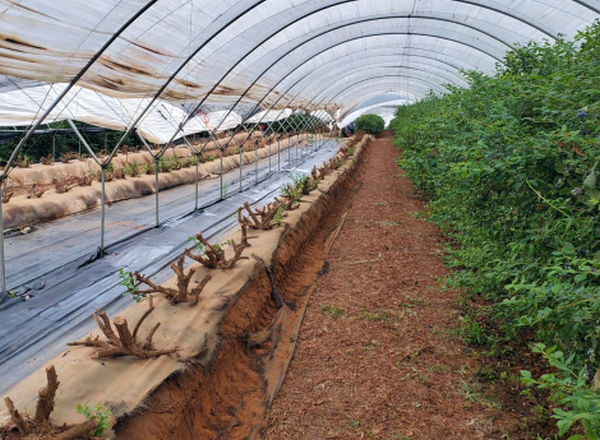
With over 470 hectares of protected blueberry production across 9 farms, African Blue is Morocco's largest blueberry producer. However, due to the size, one of the major challenges they faced was the accessibility of climate and plant health data across the farms to inform farm management decisions. Because of this, African Blue turned to WayBeyond's FarmRoad digital agronomy solution as the single platform to continuously monitor and visualize their farms' climate and plant health data.
The problem
With a high number of farm sites over such a large area, African Blue's main issue was the lack of visibility of farm climates as a whole. Key information was captured or retrieved manually, siloed, and not easily available in a timely fashion.
"We needed a crop monitoring and management solution that could bring all the data types from our farms together in one place to be visualized in real time. With this, we could get a better understanding of what was going on, and it would provide me with insights into crop development across all our farms without needing to be at the farms themselves," says Aziz Elkahlaoui, Horticultural Manager at African Blue.
FarmRoad
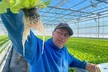
The solution came in the form of WayBeyond's FarmRoad digital agronomy solution, which comprises of sensors, a mobile data capture app, and a data visualization and analytics platform. African Blue's staff use the mobile app to digitally collect crop measurements and scouting observations. Data from the sensors and the app is fed into the visualization and analytics platform to enable continuous measurement of climate and plant health data.
"Today, I can see an overview of the farms for myself instead of making multiple phone calls to multiple farm managers to ask for updates. I'm getting faster, more accurate information, and that is saving me time. From the dashboard, I can see what time they start heating because when they do, the temperature curves go up," Aziz concludes.