While summer sales patterns are in full swing, demand for fresh, frozen and canned produce continues to shift. Consumers increasingly have the opportunity to dine out and many are fatigued with their tried-and-true recipes. Restaurant transactions and spending gained back ground during the second week of June, but grocery sales, and produce along with it, remained well above the 2019 base line. This is in spite of going up against the Father’s Day 2019 sales bump that fell one week earlier than in 2020. 210 Analytics, IRI and PMA partnered to understand how produce sales continue to develop as states are emerging from the sales effects of the pandemic.
During the week of June 14, elevated everyday demand drove high gains for fresh, frozen and shelf-stable fruits and vegetables. Fresh produce year-over-year growth for this week versus the comparable week in 2019 increased 9.8%, down several points from the week prior. Year-to-date, fresh produce sales are up 10.6% over the same time period in 2019, a steady hold from the prior week. Frozen fruit and vegetables increased the most, up 22.7%. This gain is in spite of limited assortment availability for frozen vegetables and fruit, down 9.0% in average items per store selling.

Fresh produce
Fresh produce generated $1.4 billion in sales in the week ending June 14 — an additional $125 million in fresh produce sales. Vegetables, up 14.1%, still outperformed fruit (+6.1%), but the gap remained in the single digits. While the steady erosion of gains seen since the last week of April took a pause last week, it started back up the second week of June, eroding about three percentage points.
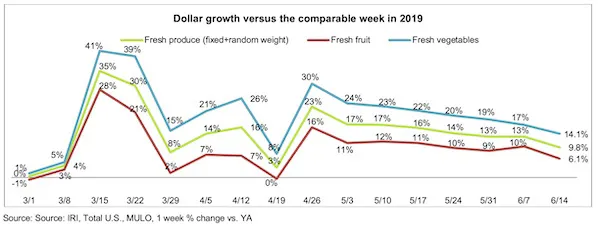
“More than three months since the two biggest panic buying weeks in the history of grocery retailing, vegetable gains are still in the mid teens versus a year ago, whereas the fruit performance is much more up and down,” said Jonna Parker, Team Lead Fresh for IRI. “Gains in vegetables illustrate that consumers are still engaging in a lot more at-home meal occasions, and the challenge now becomes how to keep those meals fun and varied. Provide tips and recipes on social media and in-store to help consumers with their meal line up fatigue.”
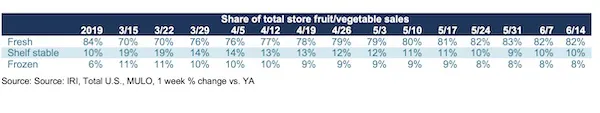
Fresh versus frozen and shelf-stable
Shoppers on the Retail Feedback Group’s Constant Customer Feedback (CCF) program commented on the improved availability, quality and freshness in the produce department in recent weeks. Out-stock-comments were few and far between, and IRI data shows an increase of 1.6% in the average number of fresh produce items sold per store the week of June 14 versus a year ago.
At $1.4 billion in sales during the week of June 14, fresh produce is significantly larger than shelf stable ($166 million) and frozen fruits and vegetables ($134 million). This means that despite lower growth percentages, fresh has been gaining back much of its lost share.
Fresh produce dollars versus volume
With dollar gains at +9.8% during the week ending June 14, and volume sales at +7.6%, the gap between fresh produce volume and dollar gains narrowed slightly to 2.2 percentage points. This marks the fourth week where dollar sales outpaced volume sales, but compared with the 15-point volume/dollar gap in fresh meat, produce inflation remained relatively mild.
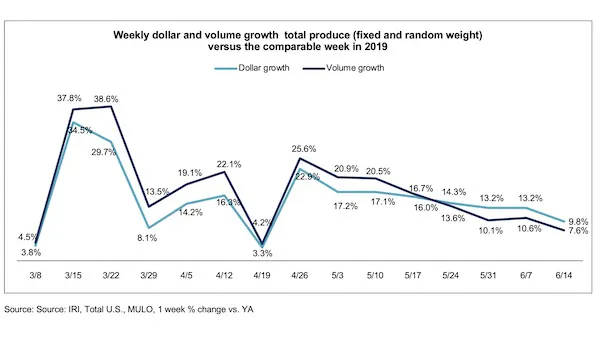
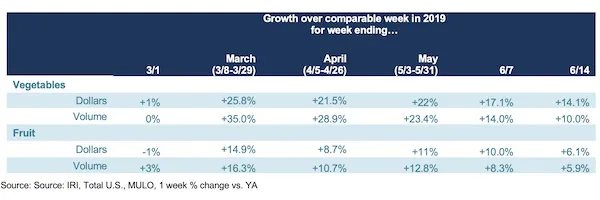
Both fruit and vegetables saw volume growth tracking ahead of dollars the week of June 14 versus the comparable week in 2019. However, the volume/dollar gap for fresh vegetables was increased to more than four percentage points. In fruit, dollar gains tracked just 0.2 points ahead of volume this week, less than the week prior.
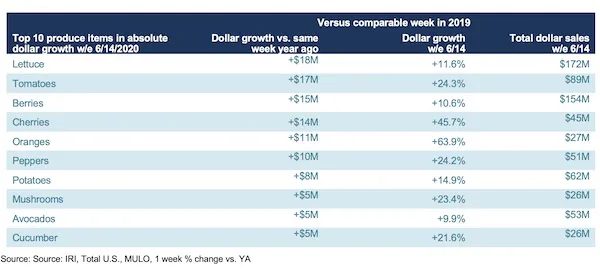
The top three growth items in terms of absolute dollar gains for the week of June 14 versus a year ago were lettuce, tomatoes and berries. “Looking at absolute dollar gains shows how quickly things change from week to week,” said Watson. “In the past two weeks, cherries jumped to the top in absolute dollar gains but this week berries reclaimed their top three position, with cherries in fourth. Oranges climbed a few spots to fifth and potatoes dropped out of the top five for the first time since the onset of coronavirus in early March. Cucumbers are a newcomer to the top 10 produce items in absolute dollar gain, pushing onions off the list.”
Strong demand is driving volume along with dollar gains across the board. While some fruits and vegetables are seeing inflation, for others, prices remain depressed. Inflation is seen for several tropical and citrus fruits, including mangoes, papayas, tangelos and tangerines. On the vegetable side, inflation is seen for items such as asparagus, beans, corn, garlic and potatoes. Continued volume/dollar gaps persist for other areas, including avocados, cherries, Brussels sprouts and celery. “The strengthening demand coming out of foodservice combined with the continued elevated demand seen in retail will continue to balance out supply and demand in the coming weeks,” said Watson.
To read the full report, click here.
 For more information:
Anne-Marie Roerink
210 Analytics LLC
Tel: +1 (210) 651-2719
Email: aroerink@210analytics.com
www.210analytics.com