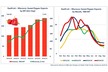
The USDA Economic Research Service (ERS) Food Expenditure Series tracks U.S. food and beverage spending, distinguishing between food consumed at home and away from home. Between 1997 and 2024, food-at-home expenditures increased from US$363 billion to US$1.091 trillion, while food-away-from-home spending rose from US$336 billion to US$1.539 trillion. Away-from-home spending overtook food at home in 2002, remaining higher except during the Great Recession and the 2020 pandemic.
In 2020, food-at-home spending rose 8% while food-away-from-home fell 12%. As restrictions eased, away-from-home expenditures rebounded 25% in 2021 and 15% in 2022. Since 2010, food-away-from-home spending has grown at about 7% annually compared with 4% for food at home. In 2024, Americans spent US$447 billion more on food away from home than at home.
Food at home
Grocery stores continue to hold the largest share of at-home spending, but have lost ground. Their share dropped from 72% in 1997 to 54% in 2024, with a temporary rebound during the 2020 lockdowns. Warehouse clubs and supercenters grew from 8% of at-home spending in 1997 to 25.5% in 2012, before easing to 23.2% in 2024. Home delivery rose from 2.7% in 2012 to 9.2% in 2024, exceeding US$100 billion for the first time. Direct purchases from farmers, manufacturers, and wholesalers have remained steady between 0.8% and 1.4%.
 © American Farm Bureau Federation
In dollar terms, grocery store expenditures grew from US$270 billion in 1997 to US$587 billion in 2024, an increase of 118%. Warehouse club and supercenter expenditures rose from US$25 billion to US$253 billion, a 911% increase, while food delivery climbed from US$9.8 billion to US$100.5 billion, up 924%.
 © American Farm Bureau Federation
Food away from home
Limited-service and full-service restaurants each account for about 35% of away-from-home spending. During the pandemic in 2020, limited-service outlets reached 38% compared with 29% for full-service, due to drive-through and app-based ordering. Retail and vending grew from 4% of away-from-home spending in 1997 to 10% in 2024.
Spending at full-service restaurants increased from US$120 billion in 1997 to US$546 billion in 2024, up 353%. Limited-service restaurant spending grew from US$112 billion to US$548 billion, up 388%. Retail and vending rose from US$11 billion to US$156 billion, a 1,270% increase.
 © American Farm Bureau Federation
Regional patterns
Per capita food-at-home spending in 2024 was highest in Alaska (US$3,918), Idaho (US$3,908), Montana (US$3,873), and Maine (US$3,773), and lowest in West Virginia (US$2,568), Connecticut (US$2,757), and New Jersey (US$2,772). Away-from-home spending was highest in Washington, D.C. (US$11,376), Hawaii (US$7,232), Nevada (US$7,151), and California (US$5,584).
To view the full report, click here.
 © American Farm Bureau FederationFor more information:
American Farm Bureau Federation
Tel: +1 202 406 3600
Email: [email protected]
www.fb.org