Part 1 : System structure and capabilities
Special series of articles on Hortidaily featuring Paskal's Plant Growth Analysis
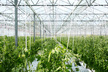
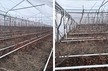
Paskal Technologies Ltd. has developed a Plant Growth Analysis system that enables the monitoring and analysis of the daily weight accumulation processes. The system weighs individual stems in the greenhouse using a weighing unit developed especially for this purpose.
Data are transferred every 20 minutes by radio to the computer and then to the server to process data using software that was developed especially for this purpose. Processed data are transferred to the grower via the Internet website on the following day. Climate and irrigation data are collected from the grower's climate and irrigation control system (see Diagram 1)
Diagram 1: System Components Scheme
During the past three years, trials were conducted in the Netherlands and Israel by growers and at experimental stations, and in 2014, 4 commercial systems were installed in the Netherlands and Canada in large greenhouses equipped with state-of-the-art technologies.
During the development stage, and thanks to the close collaboration with farmers and research institutions, Paskal developed agronomic insights based on wide-range data collection, understanding of the processes and the ability to quickly respond to the various environmental conditions.
Continuous weighing of the stem offers the unique advantage of quick identification of changes in the growth rate and in the plant's response to environmental conditions. By understanding the processes, the grower is able to identify and improve agro-technical activities.
Growth of tomato plants in various growth compartments in the greenhouse during a 4-day period is presented in graph 1. This illustrates a typical growth process in Northern countries (Canada, Holland). In some of the days, the growth rate changes throughout the day due to the impact of the environmental conditions on the water balance and temperature. This may be improved by shading, correct irrigation, raising the temperature and misting.
Graph no. 1: Tomatoes Growth Rate during a 4-day period in 6 growth compartments in a Canadian greenhouse.
Quick identification of changes in the growth rate has important agricultural and economic benefits. . The system identifies failures or changes in the growth processes long before the grower can detect that by any other measure. As a rule, by the time the grower can observe and diagnose the problem, the damage or the decrease in the growth rate already exists and it is already too late to respond properly.
By placing weighing units at various locations throughout the greenhouse , the growth rates of the various sections can be compared and the variance in the greenhouse can be assessed. This information reveals locations with a low growth rate (hotspots) and enables the grower to achieve improvement during the growth season or between seasons.
Growth rate performance in a greenhouse showing the location of the weighting units in the greenhouse is presented in diagram1. The red spots indicate lower than average growth rates, the blue spots indicate average growth rate and the yellow spots indicate higher than average growth rates. In these specific cases, one can see that the growth rates are low near the greenhouse wall.
Diagram 1: mapping of the weighing units in the greenhouse illustrating the average weight (blue) and high (yellow) and low (red) values
It should be noted that the investment and operational costs of a modern greenhouse are very high, any improvement that helps maximize revenues is very important.
The system also poses important challenges for the climate control companies. The weighing unit is actually a new sensor that can be part of the greenhouse sensors system. The weighing process provides quick feedback on the growth rates in real time. The monitoring indicate that the plant responds quickly to environmental conditions; which in turn required changes in the control approach.
The system may also be used successfully in greenhouses that are not equipped with advanced technology. (Graph 2). Here the focus is on aspects such as irrigation adjustment, fertilization, shading and salinity. In addition, the system provides an easy procedure to conduct observations and receive quick feedback on various new technologies.
Graph 2: Tomato Growth Rate during a 4-day Period in soil culture (Israel )
This graph illustrates a very typical growth process for greenhouse tomatoes during a 4-day period in hot climate areas and natural soil, where the daily yield accumulation is relatively low.
In extreme cases, the plant looses weight in the morning, immediately after sunrise. This is due to a negative water balance during the morning and the afternoon. The graph also shows the hourly growth that illustrates the growth over the course of the day. The growth process is totally different from that in countries characterized by moderate summer climate conditions (see Graph 1).
Next week, on Thursday September 25, we will publish the second article in this special serie. Dr. Menachim Dinar will then discuss the comparison and mapping of data.
For more information:
Paskal
Eliezer Adania
T +972 4 957 5877
[email protected]
www.paskal-tech.com