The market phenomenon known as “countercyclical pricing”—when retail prices decrease in times of increased consumer demand—has been documented by economists in the prices of goods such as tuna during Lent or canned soup during winter. Recent analysis by USDA's Economic Research Service (ERS) provides another example of countercyclical pricing in fresh collard greens, a staple of Southern cuisine sometimes associated with good luck when eaten on the first day of the New Year. Popularity of the leafy green has risen since 2011, with annual availability increasing 43 percent from 0.88 pounds per capita to 1.26 pounds between 2011 and 2020. To observe consumer behavior, ERS researchers used retail scanner data consisting of billions of weekly U.S. retail food transactions captured from 2013 to 2018.
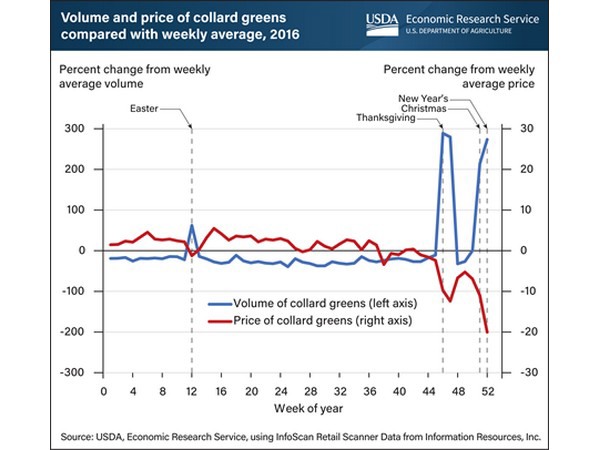
They observed consistent annual surges in collard greens purchases during the weeks of Thanksgiving, Christmas, and New Year’s Day, accompanied by a smaller spike around Easter. They noted countercyclical pricing in all years of the available collard greens data, but the trend was most distinct in 2016. The volume of collard greens purchased that year exceeded the weekly average by 62 percent around Easter, 214 percent around Christmas, 274 percent around New Year’s Day, and 289 percent around Thanksgiving. However, collard greens prices fell below the weekly average by about 1 percent for Easter, 11 percent for Christmas, 20 percent for New Year’s, and 10 percent for Thanksgiving. This chart is drawn from ERS’ Vegetables and Pulses Outlook, November 2021.
 U.S. Department of Agriculture