Consumer concern over COVID-19 remains high but stable, with 57% being extremely concerned, according to wave 16 of the IRI shopper sentiment survey series. Economic pressure, however, is mounting. Thirty percent of shoppers say they are financially worse off than they were last year and 25% indicated they are buying value-size items to save money, up from 20% in late May. Much like seen the last week of June, the final days of July into early August generated a weaker performance. While CPG and fresh sales continued to track ahead of last year, virtually every department across the store saw lower gains than those seen during the past few weeks. 210 Analytics, IRI and PMA partnered to understand fresh produce sales at retail throughout the pandemic.
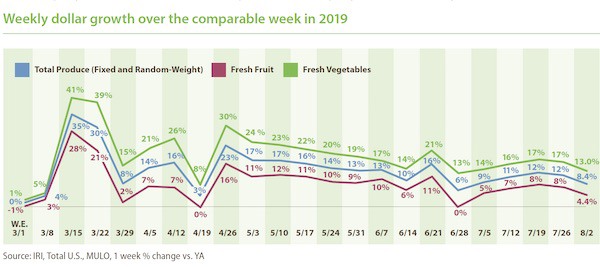
The net result for fresh produce was an increase of 8.4% over year ago during the week ending August 2 — down about three percentage points from the week prior. Frozen and shelf-stable fruits and vegetables had higher percentage gains but off a smaller base, with particular strength for frozen, at +20.3%. Year-to-date, fresh produce department sales are up 10.9% over the same time period in 2019. Frozen fruit and vegetables increased the most, up 27.6% year-to-date.
- Fresh produce increased +8.4% over the comparable week in 2019.
- Frozen, +20.3%
- Shelf-stable, +16.0%
Source: IRI, Total US, MULO, 1 week % dollar growth vs. year
Fresh Produce
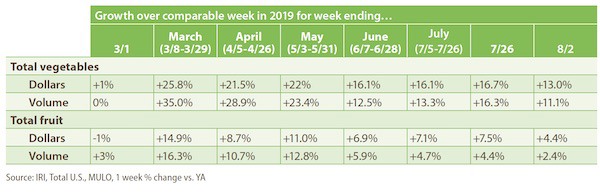
Fresh produce generated $1.34 billion in sales the week ending August 2 — an additional $104 million in fresh produce sales over the prior year. Growth rates for both vegetables and fruit dropped versus the prior week levels. Vegetable gains, while 13.0% ahead of last year, saw the lowest increase since the start of the pandemic sales patterns in mid-March, with the exception of the week ending April 19, which went up against the Easter 2019 sales numbers. Fruit gains dropped to 4.4%.
Fresh Share
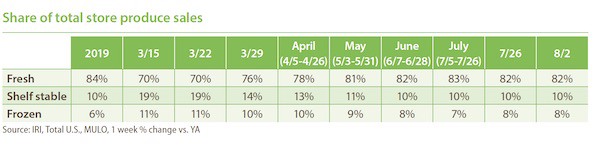
After falling to as low as 70% of total fruit and vegetable dollars across temperature zones, the fresh share had made a full comeback to its typical 84% during Independence Day week. However, as COVID-19 cases started to rise again, the fresh share has fallen back down to 82%, with above-average strength for frozen fruit and vegetable sales.
Fresh Produce Dollars versus Volume
Dollar gains continued to track ahead of volume gains ever the week of May 24. And while down from prior weeks, both dollars and volume sit comfortably ahead of 2019 levels. Overall, dollars tracked 2.6 percentage points ahead of volume, however, the overall view is a bit misleading with many areas seeing double-digit inflation or deflation.
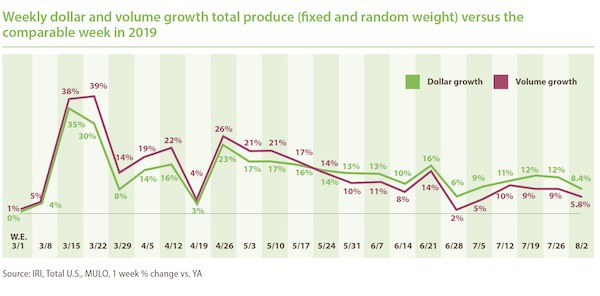
Both fruit and vegetables saw dollar sales gains track ahead of volume gains, by about two percentage points. Fruit volume gained 2.4% over the same week last year, showing demand is up but not quite keeping pace with other foods. Vegetable volume growth remained in double digits during the week ending August 2.
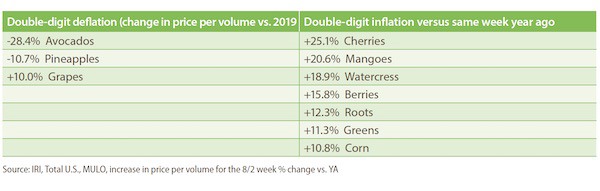
While overall inflation may be mild, supply and demand continue to be out of sync in many areas, causing double digit gaps in dollar gains and volume gains in either direction. Ample supply is driving double-digit deflation for items such as avocados, pineapples and grapes. On the other hand, dollar gains are far outpacing volume due to double-digit inflation for items such as cherries, mangoes, berries and corn.
Absolute Dollar Gains
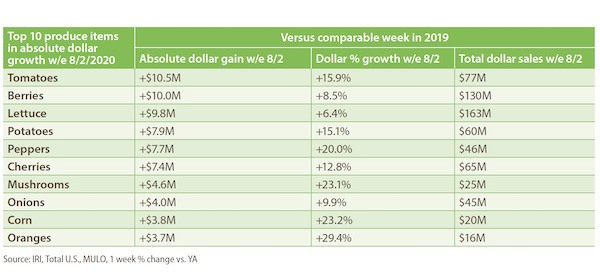
The top 10 in absolute dollar gains completely changed from the week prior yet again. Taking over from lettuce, tomatoes contributed $10.5 million in new sales versus year ago as the number one in absolute dollar gains. Berries was second with a gain of $10 million, boosted by 15.8% inflation. “The top 10 in absolute dollar gains shows how much sales contributions can change each week,” said Watson. “Seven out of the 10 items are vegetables, which explains the above-average strength in performance versus fruit that we have seen throughout the pandemic. Oranges, the pandemic consumer favorite, made it back into the top 10 on weaker melon gains, that dropped out of the top 10.”
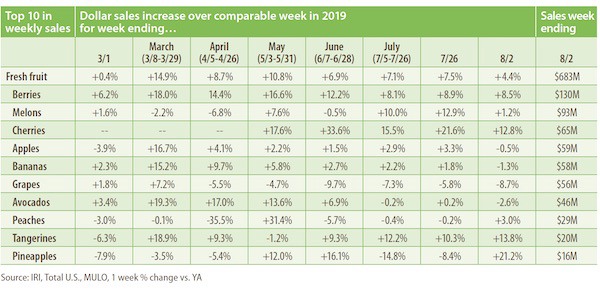
Fresh Fruit
“In fruit, berries and melons dominated total weekly sales in early August,” said Watson. “One important reason why fruit sales are falling behind vegetables each week is that some of the largest categories are not gaining aggressively or even losing ground,” said Watson. “In other cases, sales are going up against a very high 2019 bar. For instance, with melon sales in their high season, gains were just 1.2% versus year ago, but sales actually increased versus the week prior. Lastly, dollar gains and losses are heavily impacted by deflation and inflation in the current marketplace.”
During the week of August 2, double-digit gains in the top 10 sellers were reserved for cherries and tangerines. Oranges had the highest gains of all fruits, at +29.4%, but fell outside the top 10 in biggest sellers. Sales of apples, grapes and avocados tracked in negative territory versus year ago.
To read the full report, click here.
 For more information:
Anne-Marie Roerink
210 Analytics LLC
Tel: +1 (210) 651-2719
Email: aroerink@210analytics.com
www.210analytics.com