The week ending June 28 was the week in between Father’s Day and the Fourth of July, which means everyday demand alone was driving the sales numbers. Food and beverage sales remained well above last year’s levels as consumers bought for the additional at-home meal occasions, particularly breakfast and lunch. At the same time, shoppers continued to mix and match fresh with center store items, including for produce, where gains for frozen and canned remained highly elevated. 210 Analytics, IRI and PMA partnered to understand how produce sales continue to develop throughout the pandemic as some states have reversed the relaxation of social distancing measures, including the reopening of bars and restaurants.
During the week ending June 28, elevated everyday drove gains of 5.8% for fresh produce — the lowest growth rate since April 19 when sales went up against the 2019 Easter holiday bump. Frozen and shelf-stable fruits and vegetables did continue to see double-digit gains, with particular strength for frozen, at +22.0%. Year-to-date, fresh produce sales are up 10.6% over the same time period in 2019. Frozen fruit and vegetables increased the most, up 33.6% year-to-date. This is in spite of limited assortment of frozen vegetables and fruit, down 13.1% in average items per store selling.
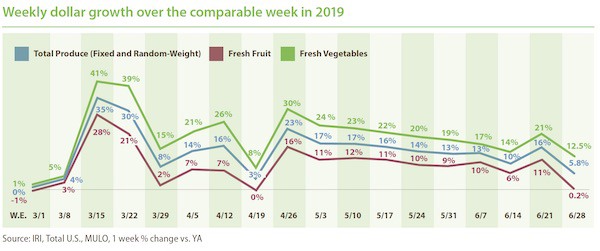
- Fresh produce increased +5.8% over the comparable week in 2019.
- Frozen, +22.0%
- Shelf-stable, +15.1%
Source: IRI, Total US, MULO, 1 week % dollar growth vs. year ago
Fresh Produce
Fresh produce generated $1.36 billion in sales the week ending June 28 — an additional $75 million in fresh produce sales. Vegetables, up 12.5% from the prior year, had a 12.3 percentage point lead over fruit. Fruit gained a mere 0.2% over last year, despite price increases. This was the lowest gain since the week of April 19 (Easter 2019) for both fruit and vegetables.
“The meager fruit gain is a bit worrisome,” said Jonna Parker, Team Lead, Fresh for IRI. “With the great assortment of summer fruits and all the added meal occasions, fruit should have good opportunity to gain year-over-year. At the same time, we know fruit is much more impulse driven versus vegetables and the lack of trips no doubt has a negative impact. That means the solution is optimizing planned fruit purchases by driving demand beyond the four walls of the store.”
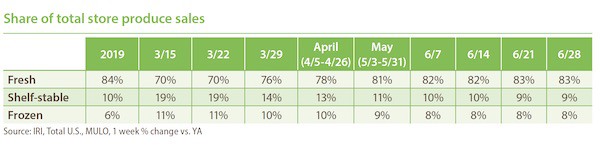
Fresh Share
Despite much lower gains for fresh versus frozen and canned, the produce department held steady at 83% of total fruit and vegetable sales across the store. At $1.36 billion in sales during the week of June 28, fresh produce is significantly larger than shelf stable ($155 million) and frozen fruits and vegetables ($124 million), which means growth percentages are likely to be much lower.
Fresh Produce Dollars versus Volume
After narrowing significantly during Father’s Day week, the volume/dollar gap jumped back up to reach its highest point since the onset of the pandemic. Across all fresh produce, dollar gains paced 4.2 percentage points ahead of volume gains.
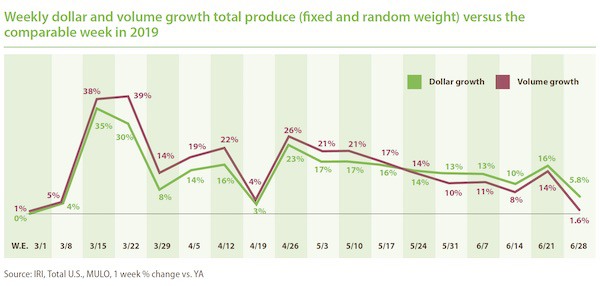
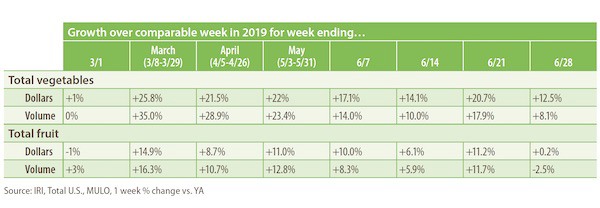
The gap was driven by both vegetables and fruit. After tracking behind dollars the first two weeks of June, fruit volume once more outpaced fruit dollars the week ending June 21. In a pandemic first, fruit volume actually declined versus last year the week of June 28, down 2.5%. In vegetables, dollar gains also outpaced volume, at +12.5% versus +8.1%. At 4.4 percentage points, the gap reached its widest point since the onset of the pandemic.
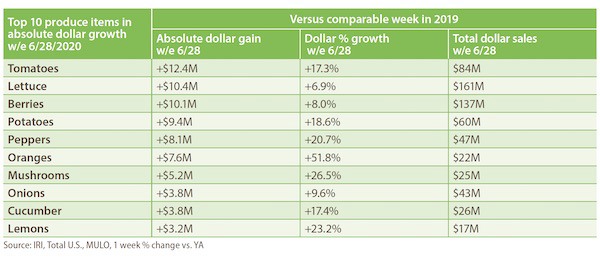
In the ever-changing top 10 in terms of absolute dollar gains, tomatoes took over as the new leader from berries during the week of June 28 versus year ago. Berries dropped to third, whereas lettuce remained in second place. “This week we are seeing a big reshuffle in the top 10, both new items and a completely different order,” said Watson. “Cherries, the number one just a few weeks ago, dropped out of the top 10 altogether, as did melons that did well just last week for the Father’s Day holiday. Newcomers are cucumber and lemons, whereas oranges continued its unbelievable sales streak, up 51.8% the week of June 28. Perhaps very telling is the fact that only three out of the 10 items are fruit.”
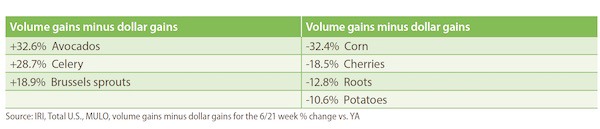
Dollar gains, however, do not tell the full story. Supply and demand continued to be out of balance for some categories, though significantly fewer than last week. Ample supply is driving higher volume than dollar gains for items such as avocados, celery and Brussels sprouts. On the other hand, dollar gains are far outpacing volume for items such as corn, cherries and potatoes. “Corn on price per volume basis is up 44.2% versus the same week last year,” said Watson. “Typically corn is a great impulse item during grilling season and can become the basket anchor for complementary purchases in meat and other departments. However, in the current corn market this is hard to accomplish and one area where shoppers will switch to frozen and canned in response to pricing.”
To read the full report, click here.
 For more information:
Anne-Marie Roerink
210 Analytics LLC
Tel: +1 (210) 651-2719
Email: aroerink@210analytics.com
www.210analytics.com