Manual pollination is making a comeback in countries where labor is cheap. It can be cheaper to manually pollinate than to import beehives. Some countries have import restrictions on live animals and insects making it difficult to import bumblebees.
If there is a lot of insect pressure, frequent sprays can make the use of bees impossible. More recently it has been suggested that Bumblebees can transmit the feared Tomato Brown Rugose Fruit Virus.
 Bruise marks
The importance of pollination cannot be underestimated, states Godfrey Dol in the last part of his series about pollination. It is by far the most important process related to yield and quality. It makes sense then to implement a quality control system that shows pollination is optimum, both for manual and bumblebee pollination.
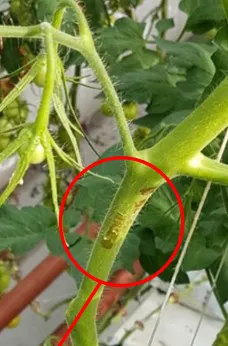
In the case of manual pollination, bruise marks made by an electric bee (See Figure 1) can be used to determine if a staff member has pollinated the plant appropriately. If there are too few bruise marks this implies a risk of poor pollination. The position of the bruise mark needs to be near the truss stem of the flowering truss.
Figure 1; Bruise mark from manual pollination
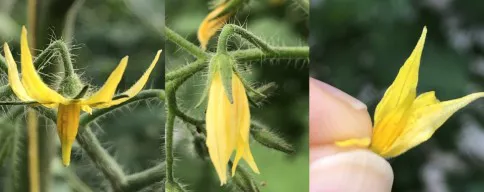 Figure 2; Bruise marks from bumblebees.
Check 18-50 flowers per hectare
To ensure every flower was visited by a bee, the grower can make use of a handy side effect of bumblebee pollination. In collecting pollen, a bee slightly bruises the cone of the yellow flower leaving a brown mark (see figure 2, left-hand side picture).
These brown marks can be used to help determine how many hives must be ordered. The best way is to inspect a closed flower (Figure 2, middle picture).
Pollination of this flower has already taken place. To see if the flower was pollinated by a bee, peel back the dried-up flower petals to see if bruising is visible (Figure 2 right-hand side picture).
About 18-50 flowers per hectare must be checked, covering a representable area of the glasshouse.
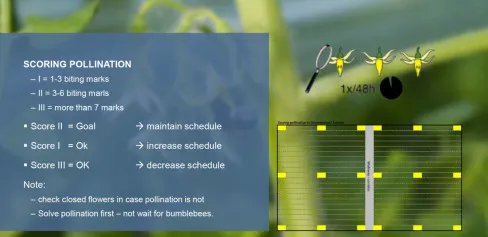 Figure 3 Koppert’s recommendation for checking pollination.
Figure 3 shows the recommendation Koppert makes to growers to make sure optimum pollination is assured. Most tomato types have a recommended introduction of number of hives per hectare per week (or two weeks in faraway countries to save on shipping cost) The intensity determines if more or less bees should be ordered.
Assessing Success Rate
With so many factors affecting pollination, it is a mammoth task to keep the plant and climate conditions in a continuous "Goldilocks" state. In climates with cool summers, it may seem like overkill or extra work to try and assess pollination. But particularly in climates with warm summers, the pollination can be affected by a myriad of factors.
To make sure the grower has kept everything “just right,” a feedback loop is required to assess if pollination has worked. As in other complex systems, an absolute value may not be so absolute if other conditions are also on the fringe.
Assessing the quality of fruit formation, the grower can trace back what condition may have affected pollination and or setting at a specific time, and what the root cause was. After all, to measure is to know, and what gets measured, gets improved.
 Scoring Pollination
I developed a score that converts the success of making fruit into a number. With a bit of training, this score can be part of plant registration or used as a quantitative tool to try and improve pollination. It can also play a role in yield prediction.
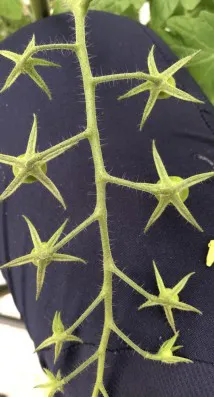
Figure 4; Pollination assessment of poor truss.
To illustrate how the scoring works, Godfrey gives an example of the assessment of the truss shown in figure 4. The results are shown in the table in figure 5. The tomato plant in question is a truss tomato with an average fruit weight of 150 grams. The truss is pruned to 5. For each of the fruit missing Godfrey subtracts 20%. There are two fruit missing in the example, so the pollination rate is reduced to 60% as indicated by the red circle.
The next column with the heading oO indicates how many fruits in the truss are smaller than the fruit ahead of it. In this case, the fruits are properly sequenced so there is no subtraction for this.
The next step is to look at the overall setting. The first two fruit are missing, and the remaining fruit do not have perfect shape, so the assessment is -10% for poor setting. This results in a total score of 60%-0%-10%= 50%. To achieve high yields the pollination rate should always be higher than 95%. The score of 50% also means that from this truss we can expect 50% less yield.
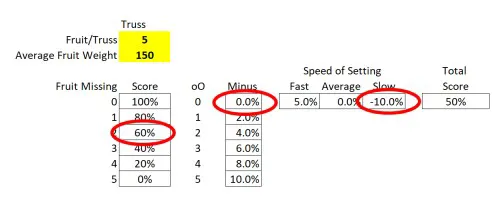 Figure 5; Example of Assessment of Pollination Success Rate
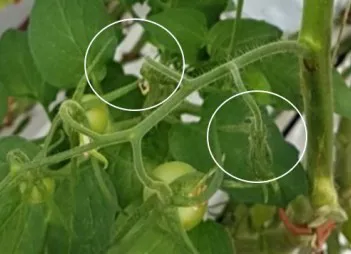
Figure 6; Assessing a cherry truss for pollination (below)
 For a second example consider the cherry truss in figure 5.15. The truss is pruned to 12. The tomatoes are sequenced in size properly except for the first two fruit. Fruit one is more than 10% smaller in size than the following fruit which qualifies it as a missing fruit.
Fruit number 2 is smaller than fruit number 3 but by less than 10%. This fruit is still marketable but attracts a negative score of 0.8%. The 0.8% score comes from dividing the maximum pollination discount (=10%) by the total number of fruit (12), which equals 0.8% per fruit.
Score after truss pruning
In the pollination count, growers are, according to Godfrey, assuming that fruit with more than a 10% reduction in size compared to the next fruit, becomes unmarketable. When the fruit size is less than 10% smaller, it is still marketable, but growers take off 10% of the fruit weight for each fruit.
In this case, the overall setting is good, resulting in a total score of 91.2% (92%-0.8%-0%). If the setting is fast, as illustrated in the photos in figure 5.5 and 5.9, a positive score of 5% can be added. If this happens, it is possible to achieve a score of more than 100%.
Alternately, if the truss has enough fruit, the first two fruit can be pruned while still keeping 12 fruit on the truss. In this case a 10% reduction applies to the score as the average weight of this truss is less. For this reason, it is important to do the scoring after truss pruning, states Godfrey.
 Figure 7; Scoring a cherry truss for pollination
Yield prediction
While the scoring is far from perfect, when performed weekly, it does provide a tool to understand whether pollination is good, improving or getting worse. Combined with an assessment of whether bees or manual pollinators are doing their job, this tool together with the information given in this series, should be able to provide the glasshouse manager with the reason why pollination is not optimal.
In the case of the large truss example, the bruise marks on the plant make clear that the plants were properly hand pollinated. The fact that the first two fruit were missing indicates that exhaustion or vegetative calyx is the main cause of poor pollination.
In the case of the cherry truss, it could also be exhaustion or not enough bees. Tools such as plant registration and climate registration will complete the picture necessary to get a good overview of why pollination is not 100%. After all, growers assess staff on the quality of their work, according to Godfrey. The importance of pollination for quality and yield mandates that growers do the same for pollination.
Lastly, there are models available to predict yield. When pollination is perfect, these models work well. The difficulty of predicting the yield properly starts when pollination is not perfect. Performing assessments like the one suggested above provides a multiplication factor for reducing the predicted yield as a result of less than perfect pollination.
This article is the final one in a series of three about pollination.
Part I - "Without proper pollination, all greenhouse techniques are reduced to nothing"
Part II - What does good pollination look like?
For more information:
Glasshouse Consultancy
www.glasshouse-consultancy.com
Godfrey Dol
LinkedIn
godfrey@glasshouse-consultancy.com
+81 80 700 94 006