From the start of the current season, the tomato grower A+G van den Bosch is working with the Paskal weighing system, by monitoring the weight of plants it is possible to assess the effectiveness of the cultivation measures. "You think something has a beneficial effect, but is that true? We can now read it on graphs," explains producer Bart van den Bosch.
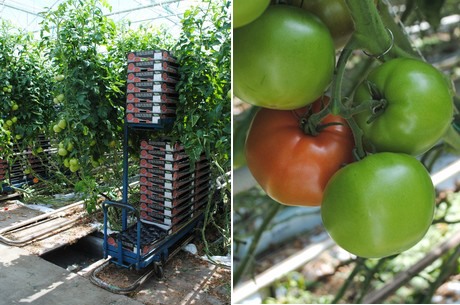
Tomatoes are a sensitive crop and the main focus of A+G van den Bosch is on achieving the best quality. As a result, they decided to introduce the Paskal weighing system. In the greenhouse, there are 100 small, white scales that continuously measure the plants' weight. This is compared with data from the climate computer: temperature, CO2, humidity, light - everything is possible. "You have to specify what you want to know," says producer Bart van den Bosch while browsing through the graphs on his tablet. "You will obtain a lot of data. It takes some time to make it manageable and ready for use." However, half a year after the introduction of the system, he clearly sees the value of it.
Growing with warmer temperatures
One of the reasons to adopt the Paskal weighing system was the discussions regarding cultivation that took place at A+G van den Bosch. "You think that a given measure has a beneficial effect on the plant, but is it true?" wonders Van den Bosch. "Now we can read it." The choice to increase the temperature in the morning, for example, was influenced by it. "According to the calendar, it was summer, but it seemed to us it was too cold in the morning. We have increased the temperature and this has resulted in a better production. Furthermore, you see the effect on the graph even before you see it on the plants."

Differences between the various sections become also clearer. "A drop in fruit weight within a given section was traditionally not easy to notice, but now it is; "last spring, growth was slower within a given section. "We saw no differences in temperature on the climate computer, but when we turned the temperature slightly up, it recovered. That small percentage would easily be lost otherwise." As growth is constantly monitored, harvest volumes can be accurately predicted.
The monitoring can easily be adapted to generative or vegetative crops. "You can also set alarms if growth is too slow, but I don't do that," laughs Van den Bosch. "The iPad is now next to the notepad in our meetings, but I also don't need non-stop information."

Source of problems
An important point to take into account when using the system is not to jump directly into conclusions; the graphs allow you to see the response of the plant, not the cause. "If your CO2, for example, does not match the plant weight, you may think that growth slows as CO2 peaks," points out Van den Bosch while he shows a peak in CO2 on the graph and a decrease in growth speed. "These actually have nothing to do with one another, so although it helps you keep an eye, you must still apply your expertise."
For more information:
Paskal Group
Michel de Winter -Regional Sales Manager
Michel@paskal-group.com
www.paskal-group.com
Paskal Group
Michel de Winter -Regional Sales Manager
Michel@paskal-group.com
www.paskal-group.com